这篇博客分享一下Akamai发布的互联网状态报告,推荐每一个网络从业人员读一读。
不一定要细看,多看看图,了解了解趋势。若能触发一些自己的思考便是极好的。
甚至以后做报告,做PTT时想要一些网络相关的图表,多看看看这个系列的报告也是收益良多的。
另外也推荐阅读后续将发布的安全报告,
尤其是被DDoS坑过的小伙伴们。T_T…
着急的可以先看看这个summary
最后也推荐有兴趣的小伙伴订阅一下stateoftheinternet网站的RSS,保持跟进。
What you need to know
>> Global average connection speed increased 17% year-over-year; South Korea leads at 23.1 Mbps.
<< 全球平均网速(connection speed)每年增加17%; 韩国领跑全球,达到23.1Mbps.
>> Global average peak connection speed reached 32.5 Mbps; up 26% year-over-year.
<< 全球平均峰值网速达到32.5Mbps,每年增长26%。
>> Gabon, Cameroon, Nepal and Iraq experienced significant Internet disruptions.
<< 加蓬、喀麦隆、尼泊尔和伊拉克存在严重的网络干扰。(呵呵一笑)
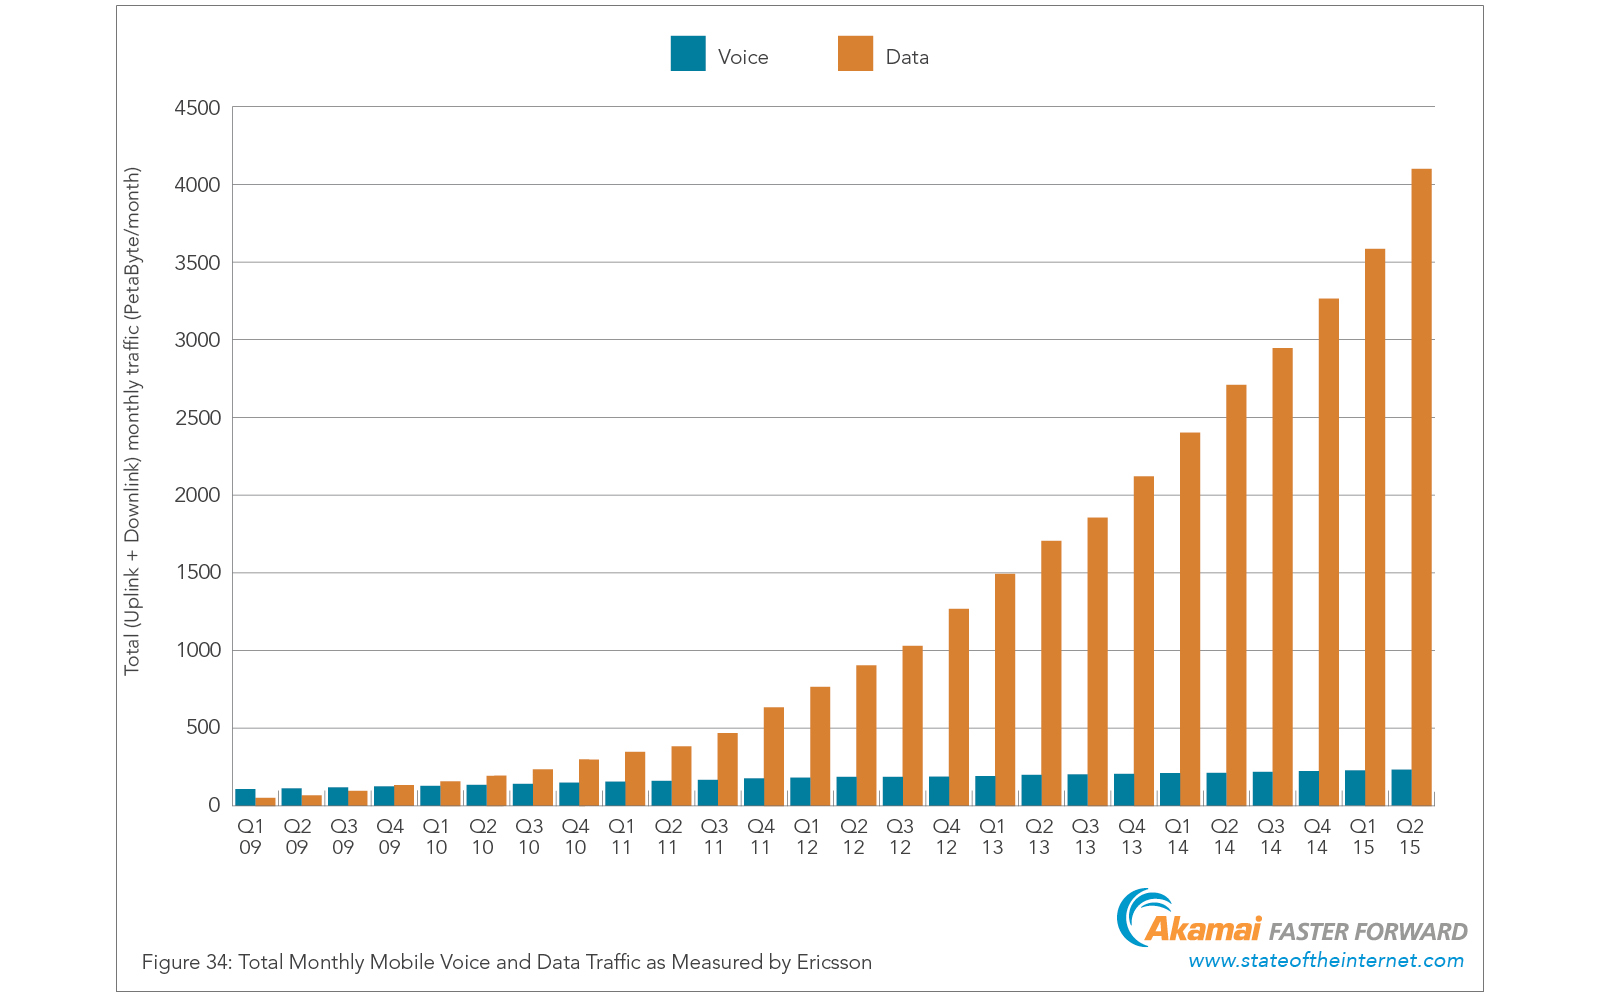
>> Mobile data traffic grew around 15% between the Q1 and Q2, and increased 55% year over year between the Q2 2014 and Q2 2015, based on traffic data collected by Ericsson.
<< 基于Ericsson的统计数据,移动数据流量Q2季度增长了15%左右,每年的增长量在55%左右。 (移动流量真是疯涨啊)
Spotlight: Internet and Broadband Adoption
The State of the Internet reports on 25 Mbps broadband connectivity, reflecting the U.S. Federal Communications Commission’s (FCC) adoption of 25 Mbps as the new benchmark broadband speed.
>> Globally, 4.9% of unique IP addresses connected to Akamai at average speeds of at least 25 Mbps, a 7.5% increase over the previous quarter.
<< 全球范围内,连接至Akamai的4.9%的IP的平均速率超过25Mbps, 这一比例相比于上一季度增长了7.5%.
>> In the United States, five states had 10% or more of unique IP addresses connect to Akamai at average speeds of at least 25 Mbps.
<< 在美国,五个州存在超过10%的连接至Akamai的IP的平均速率超过25Mbps。
>> Japan (16.4 Mbps) saw the largest quarterly gain in average speed at 7.8%.The global average connection speed increased 3.5% to 5.1 Mbps
<< 日本(16.4Mbps)在上一个季度的平均网速增长最快,增长了7.8%。全球平均网络增长了3.5%,达到了5.1Mbps.
>> Global average peak connection speeds increased 12% to 32.5 Mbps. Average peak connection speeds increased 100% in Egypt (23.4 Mbps).
<< 全球的平均峰值网速增长了12%,达到了32.5Mbps。埃及的增速达到100%,增至23.4%。
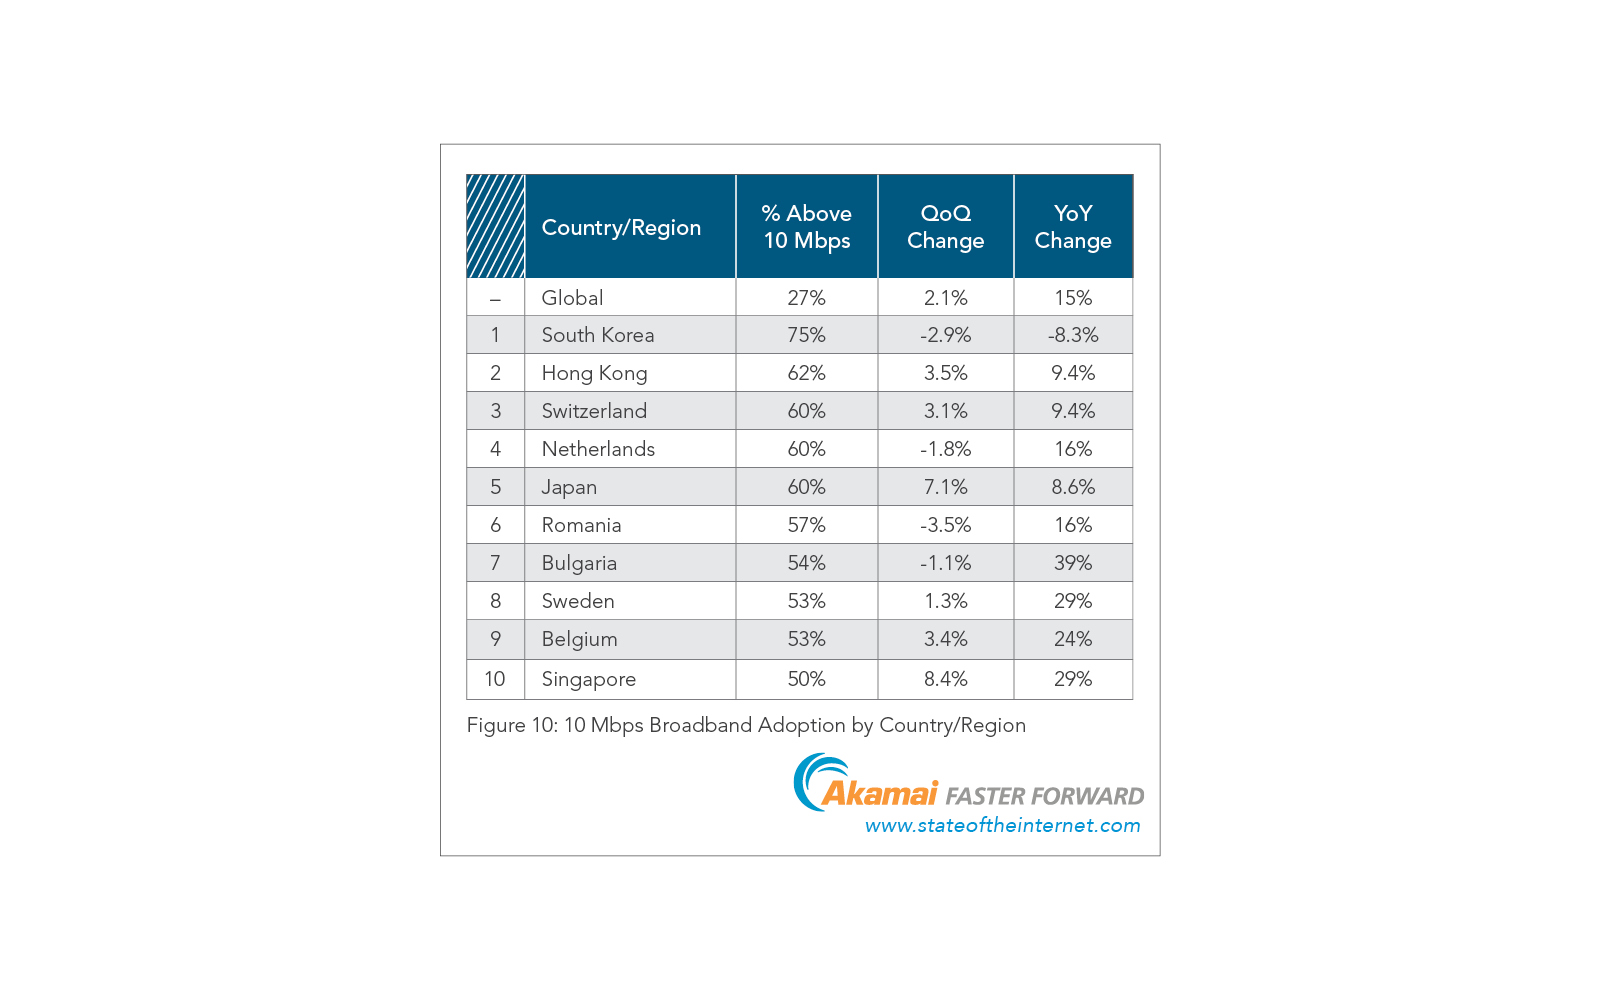
>> 27% of unique IP addresses globally connected to Akamai at average speeds above 10 Mbps, an increase of 2.1%.
<< 全球27%连接至Akamai的IP的平均网速超过10Mbps,增长了2.1%.
>> Among the top 10 countries, Singapore rose the most (8.4%) to achieve 50% adoption of 10 Mbps or higher.
<< 在网速做好的前10个国家中,新加坡超过10Mbps的比例增长最多(8.4%),达到了50%的覆盖率。
>> Among all countries, Kazakhstan rose the most (118%) to reach 16% adoption of 10 Mbps or higher.
<< 所有国家中,哈萨克斯坦超过10Mbps的比例增长最多(118%),达到了16%的覆盖率。
>> Reversing the trend seen in the first quarter, the number of unique IPv4 addresses worldwide connecting to Akamai dropped by about 8.6 million in Q2.
<< 与第一季度的趋势相反,全球连接至Akamai的IPv4地址减少了8.7million。
>> Six of the top 10 countries saw a quarterly decline in unique IPv4 address.
<< 前10的国家中,有六个国家检测到了IPv4地址的季度性下滑
>> Roughly half of the countries and regions had an increase in unique IPv4 address counts, with 34 growing 10% or more.
<< 接近一半的国家和地区IPv4地址数量在增加,其中有34个的增长率超过10%。
>> European countries continued to dominate the 10 countries and regions with the largest percentage of content requests made to Akamai over IPv6.
<< 在通过IPv6连接至Akamai的内容请求中,欧洲国家依然占据着前10名中的大多数。
>> The only two non-European counties among the top 10 were the U.S. and Peru. Both of which had significant double-digit quarterly improvements to adoption rates of 19% and 17%, respectively.
<< 两个非欧洲国家分别是美国和秘鲁。两者该季度都有两位数的覆盖率的增长,分别达到了19%和17%。
报告正文摘要
Section 1: internet penetration
Akamai在该季度发现了804 million个IPv4地址连接到了Akamai的服务,连接请求分别来自242个国家和地区。(注:IPv4的理论总数约4.2 billion,可见Akamai的实力啊。Orz…)
尽管只发现了804 million个IPv4地址,但Akamai推测这背后至少有1 billion个网名用户。因为有许多用户是通过代理,NAT等技术来访问网络的。
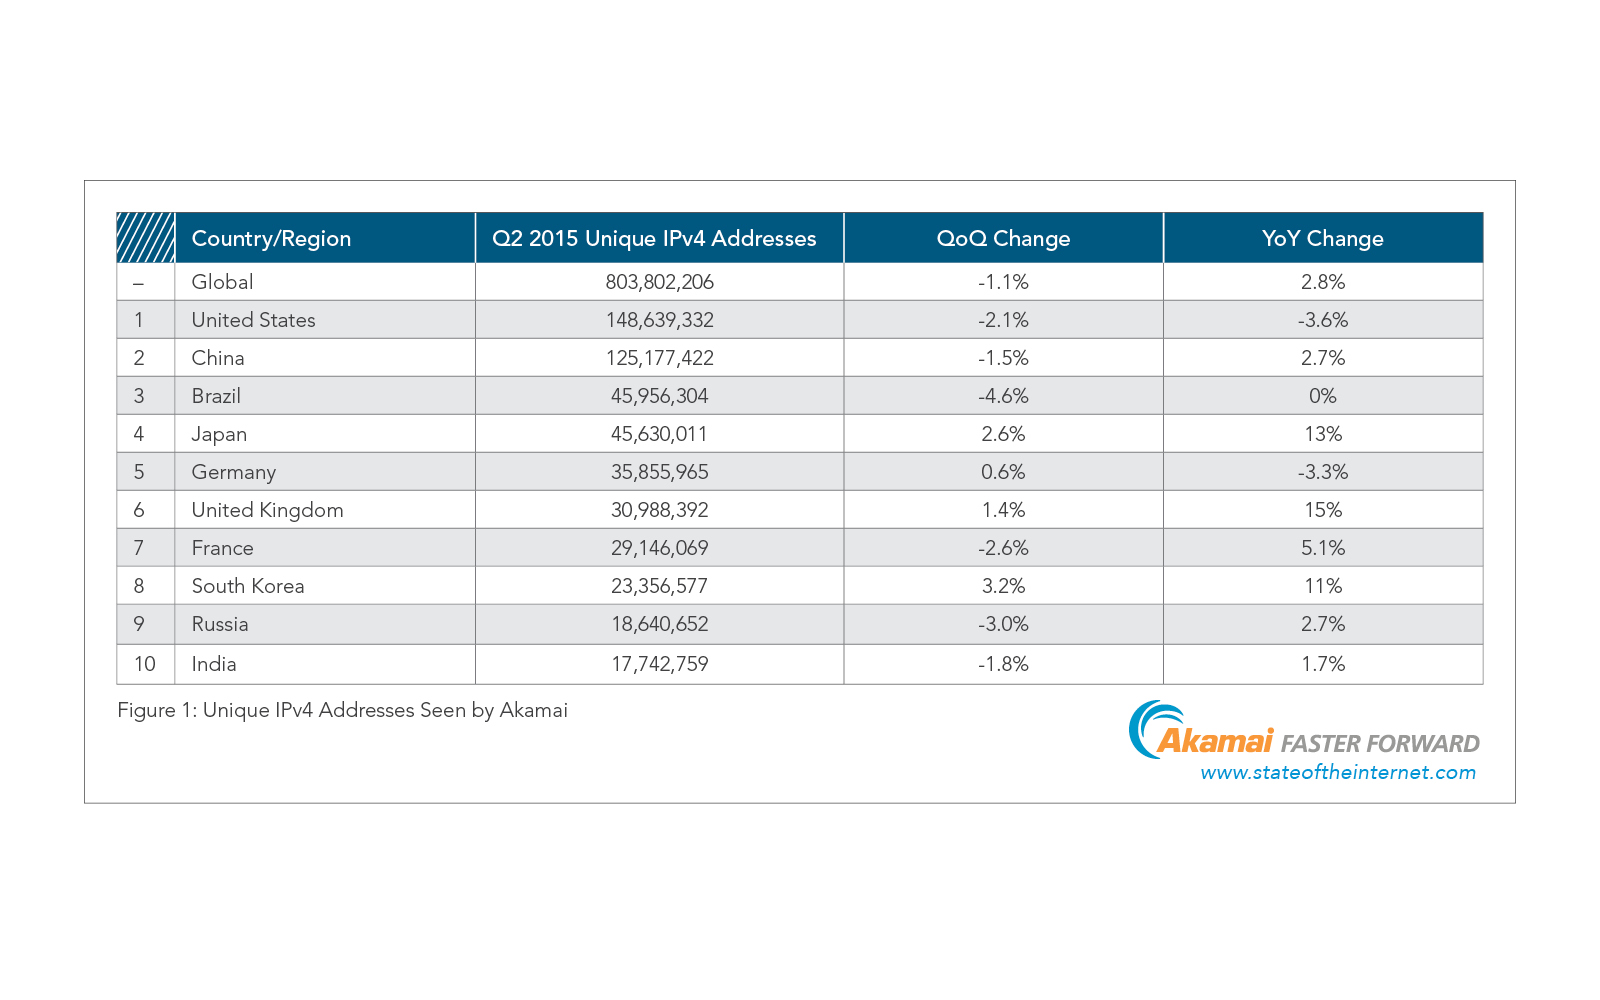
如果出现图片打不开的情况,可以自行前往下载: Figures
从上图中可以看到,美国和中国是IPv4地址的大户(很显然嘛),英国、日本和韩国的IPv4使用量每年还在以超过10%的速度在增长。
但就Q1和Q2季度而言,前十中有六个国家的IPv4地址数量在下降。Akamai的解释是认为新技术和IPv6地址的普及造成了这一现象。
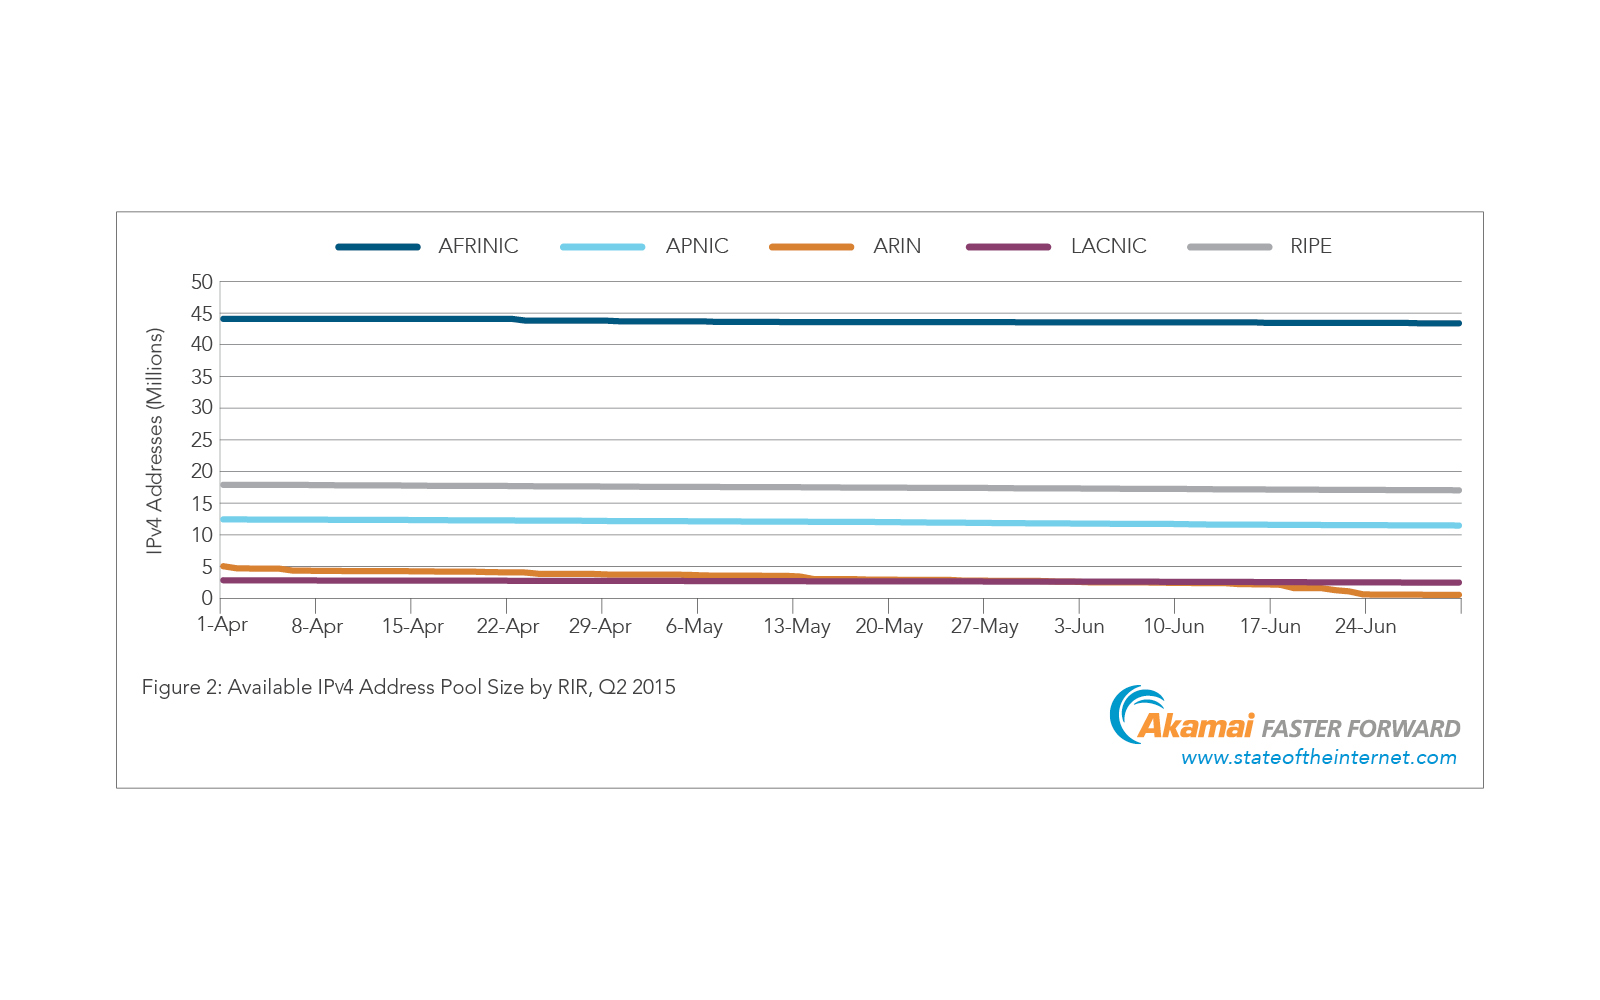
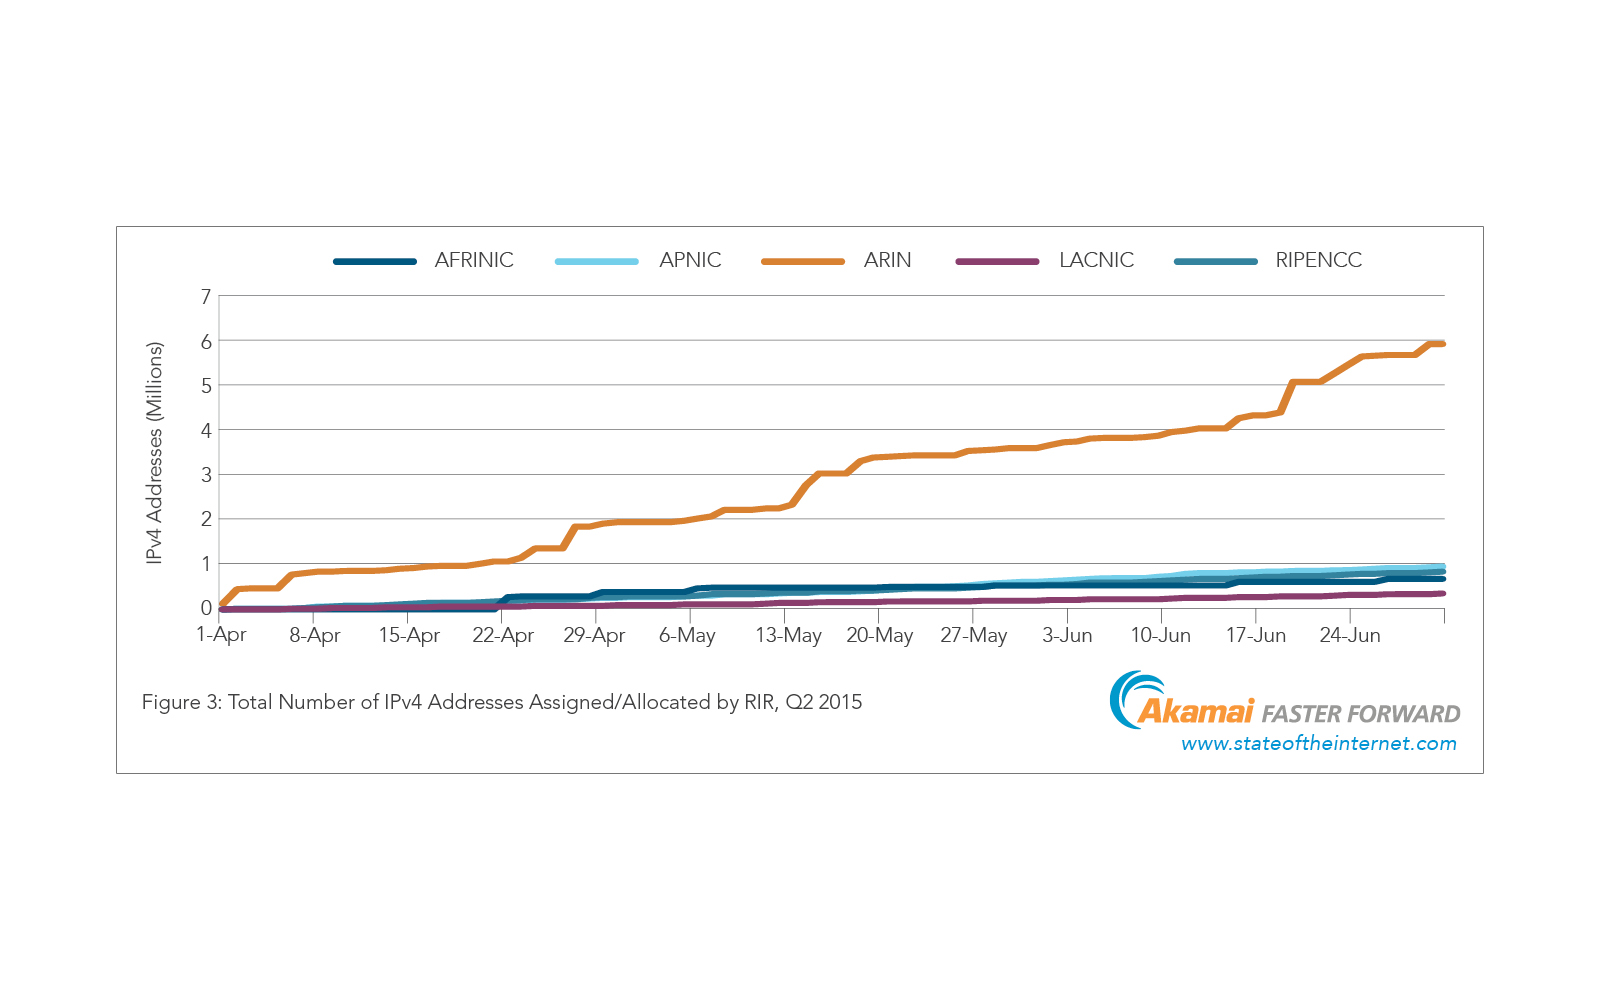
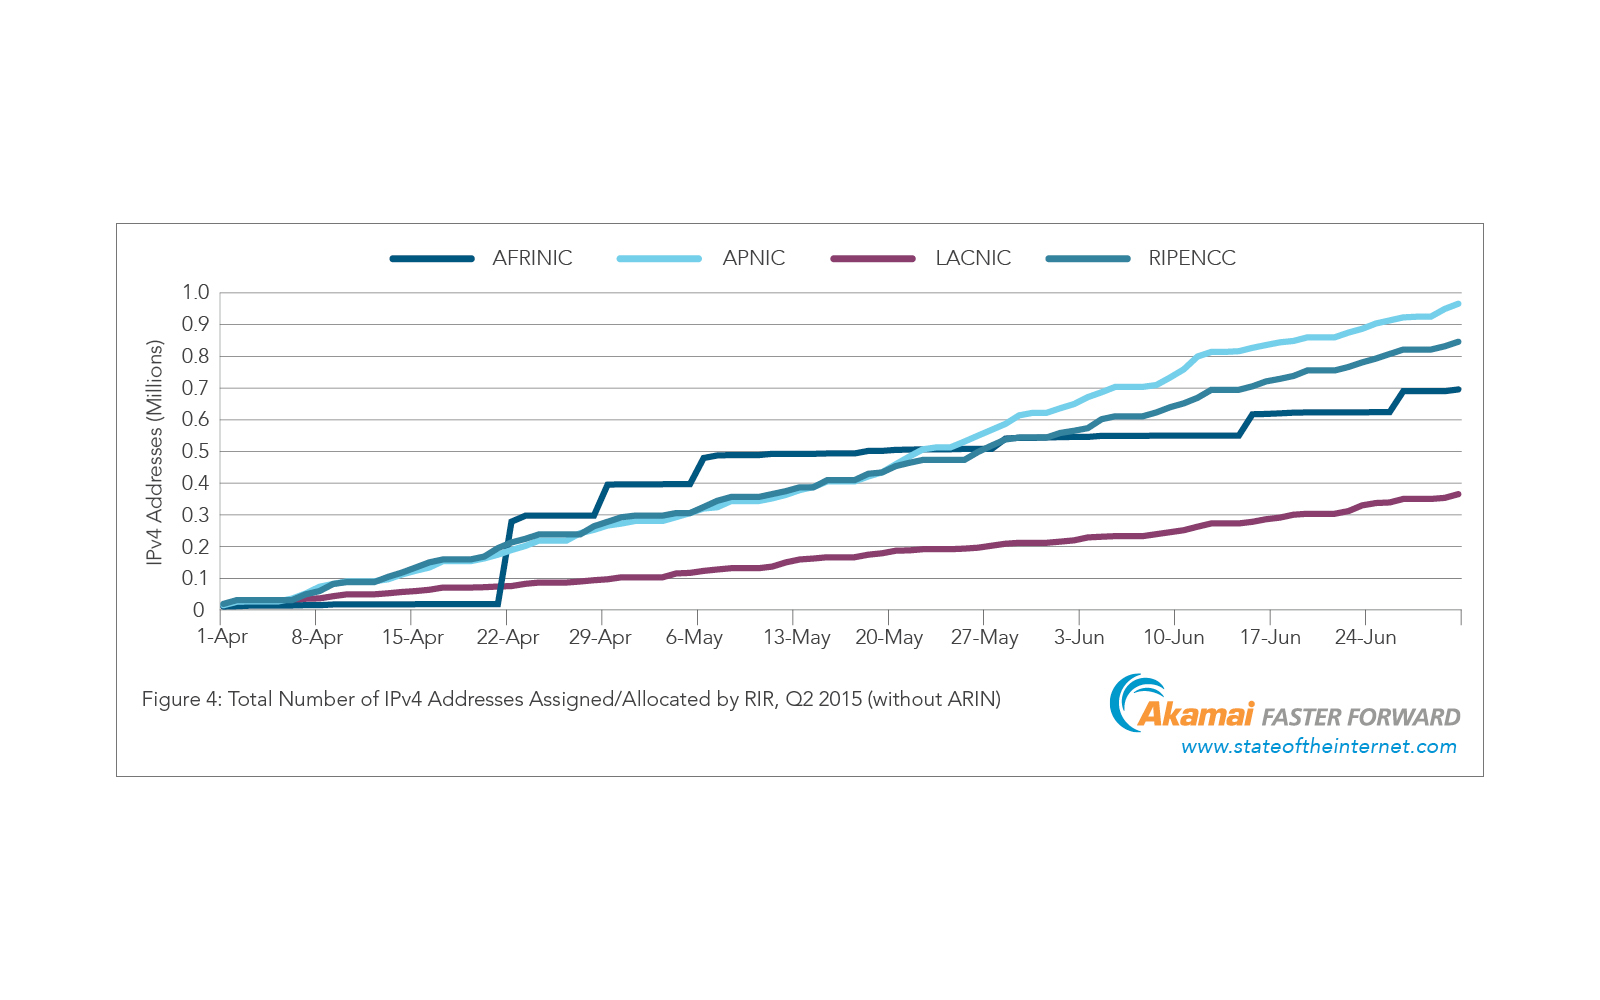
这三张图,反应的是Reginal Internet Registries(RIRs)该季度的IPv4地址存货量和分配量。
ARIN(American Registry for Internet Numbers)这个机构也是够拼的,几乎卖光了。
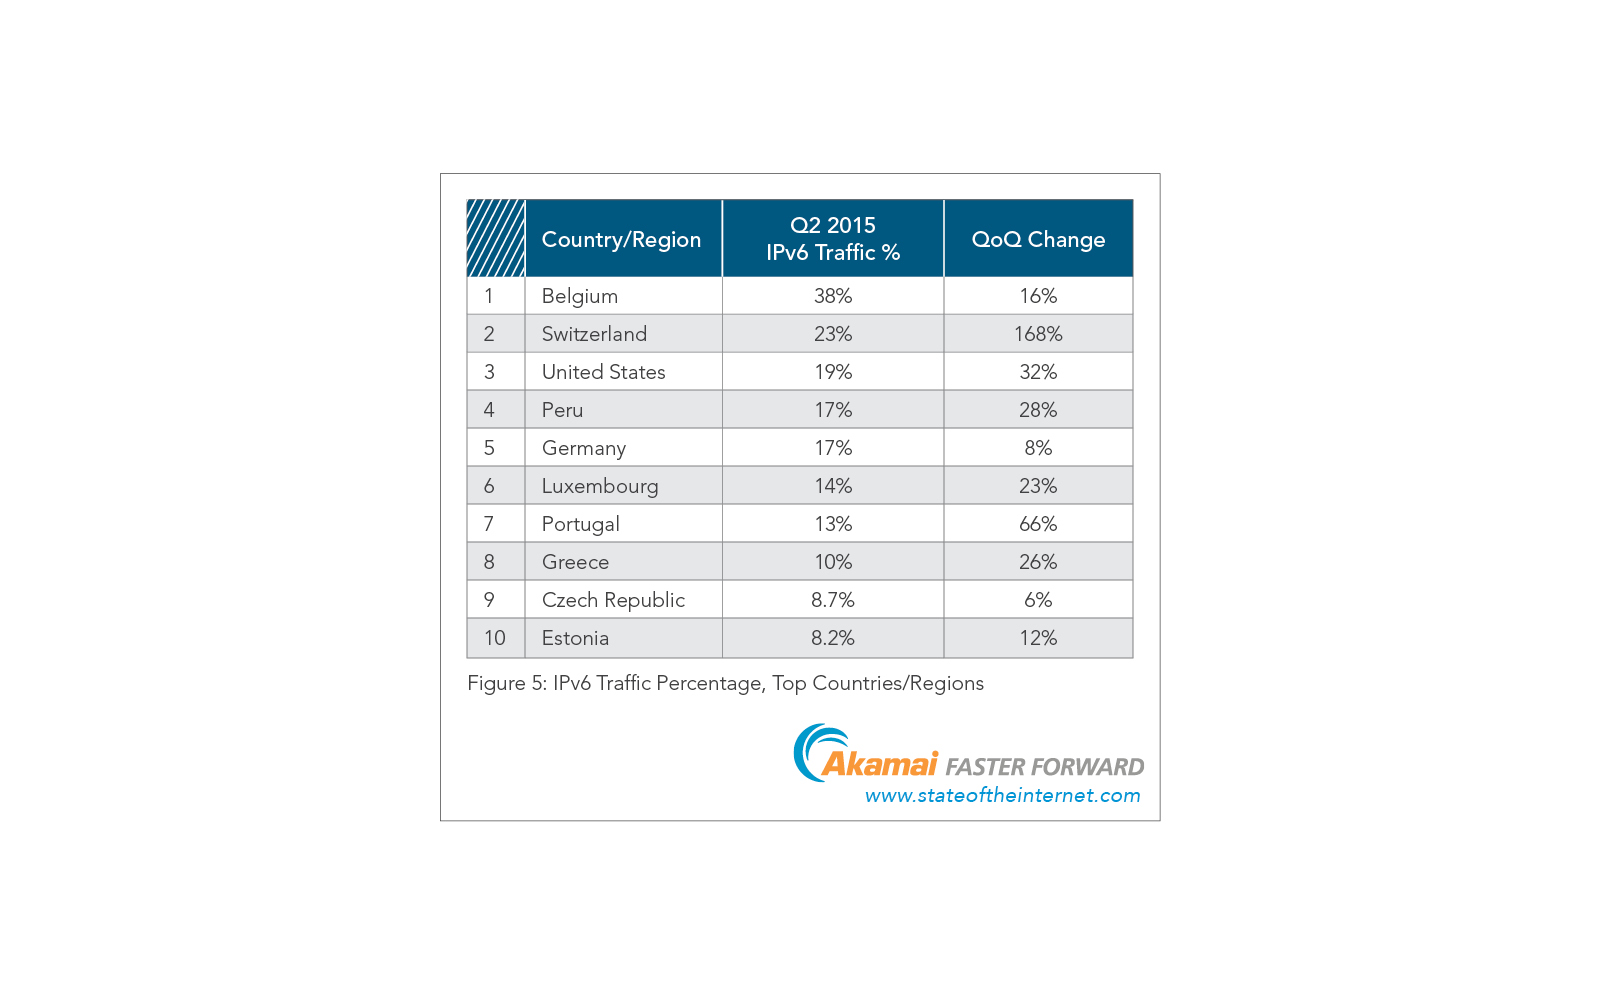
比利时和瑞士的IPv6流量都超过20%了啊,欧洲真是走在网络基础设置更新的前列啊。
Section 2-6: geography global/usa/americas/apac/emea
这几章主要是各个国家和地区的网速对比,看着略伤心。列几个图吧。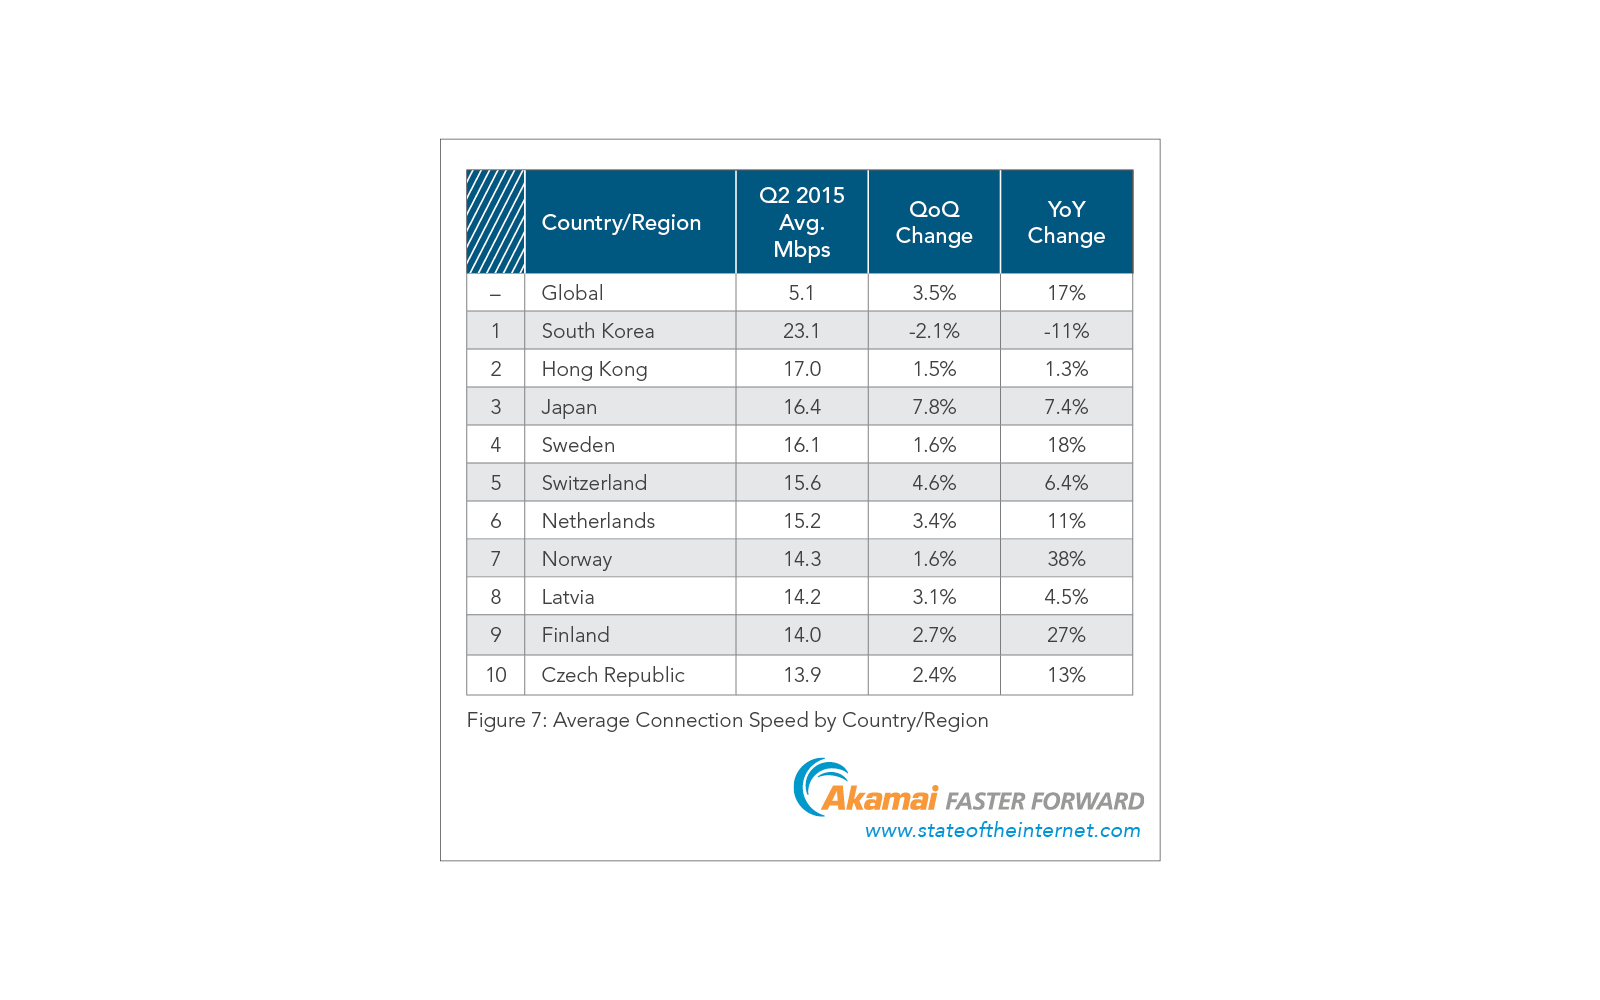
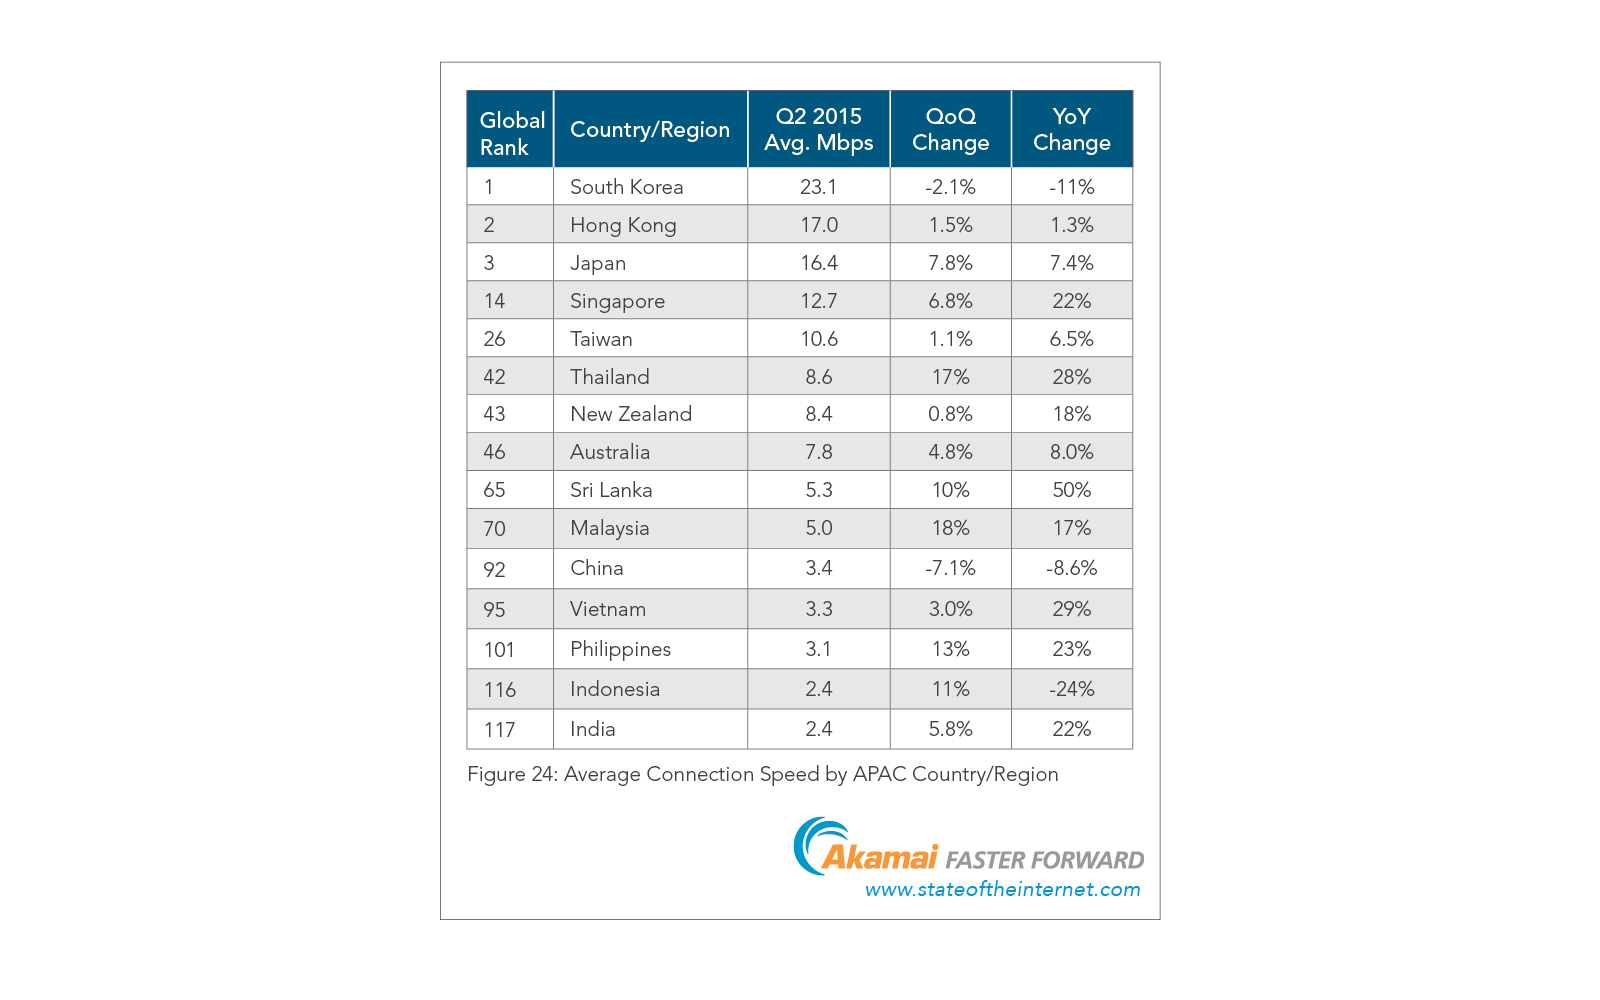
第三张图显示的数据也是让人心碎,Global Rank排名92(总计242个国家地区),而且统计的平均网速还在下降!!!太可怜了。。。
Section 7: mobile connectivity
这次关于mobile的内容由于Akamai的统计技术在做调整,因此只有下面这一张图的数据。
不过还是能反映整体mobile这边的趋势的。
Section 8: Situational Performance
这章是Akamai通过它的Real User Monitoring(RUM)技术获取的真实数据,还挺有意思的。
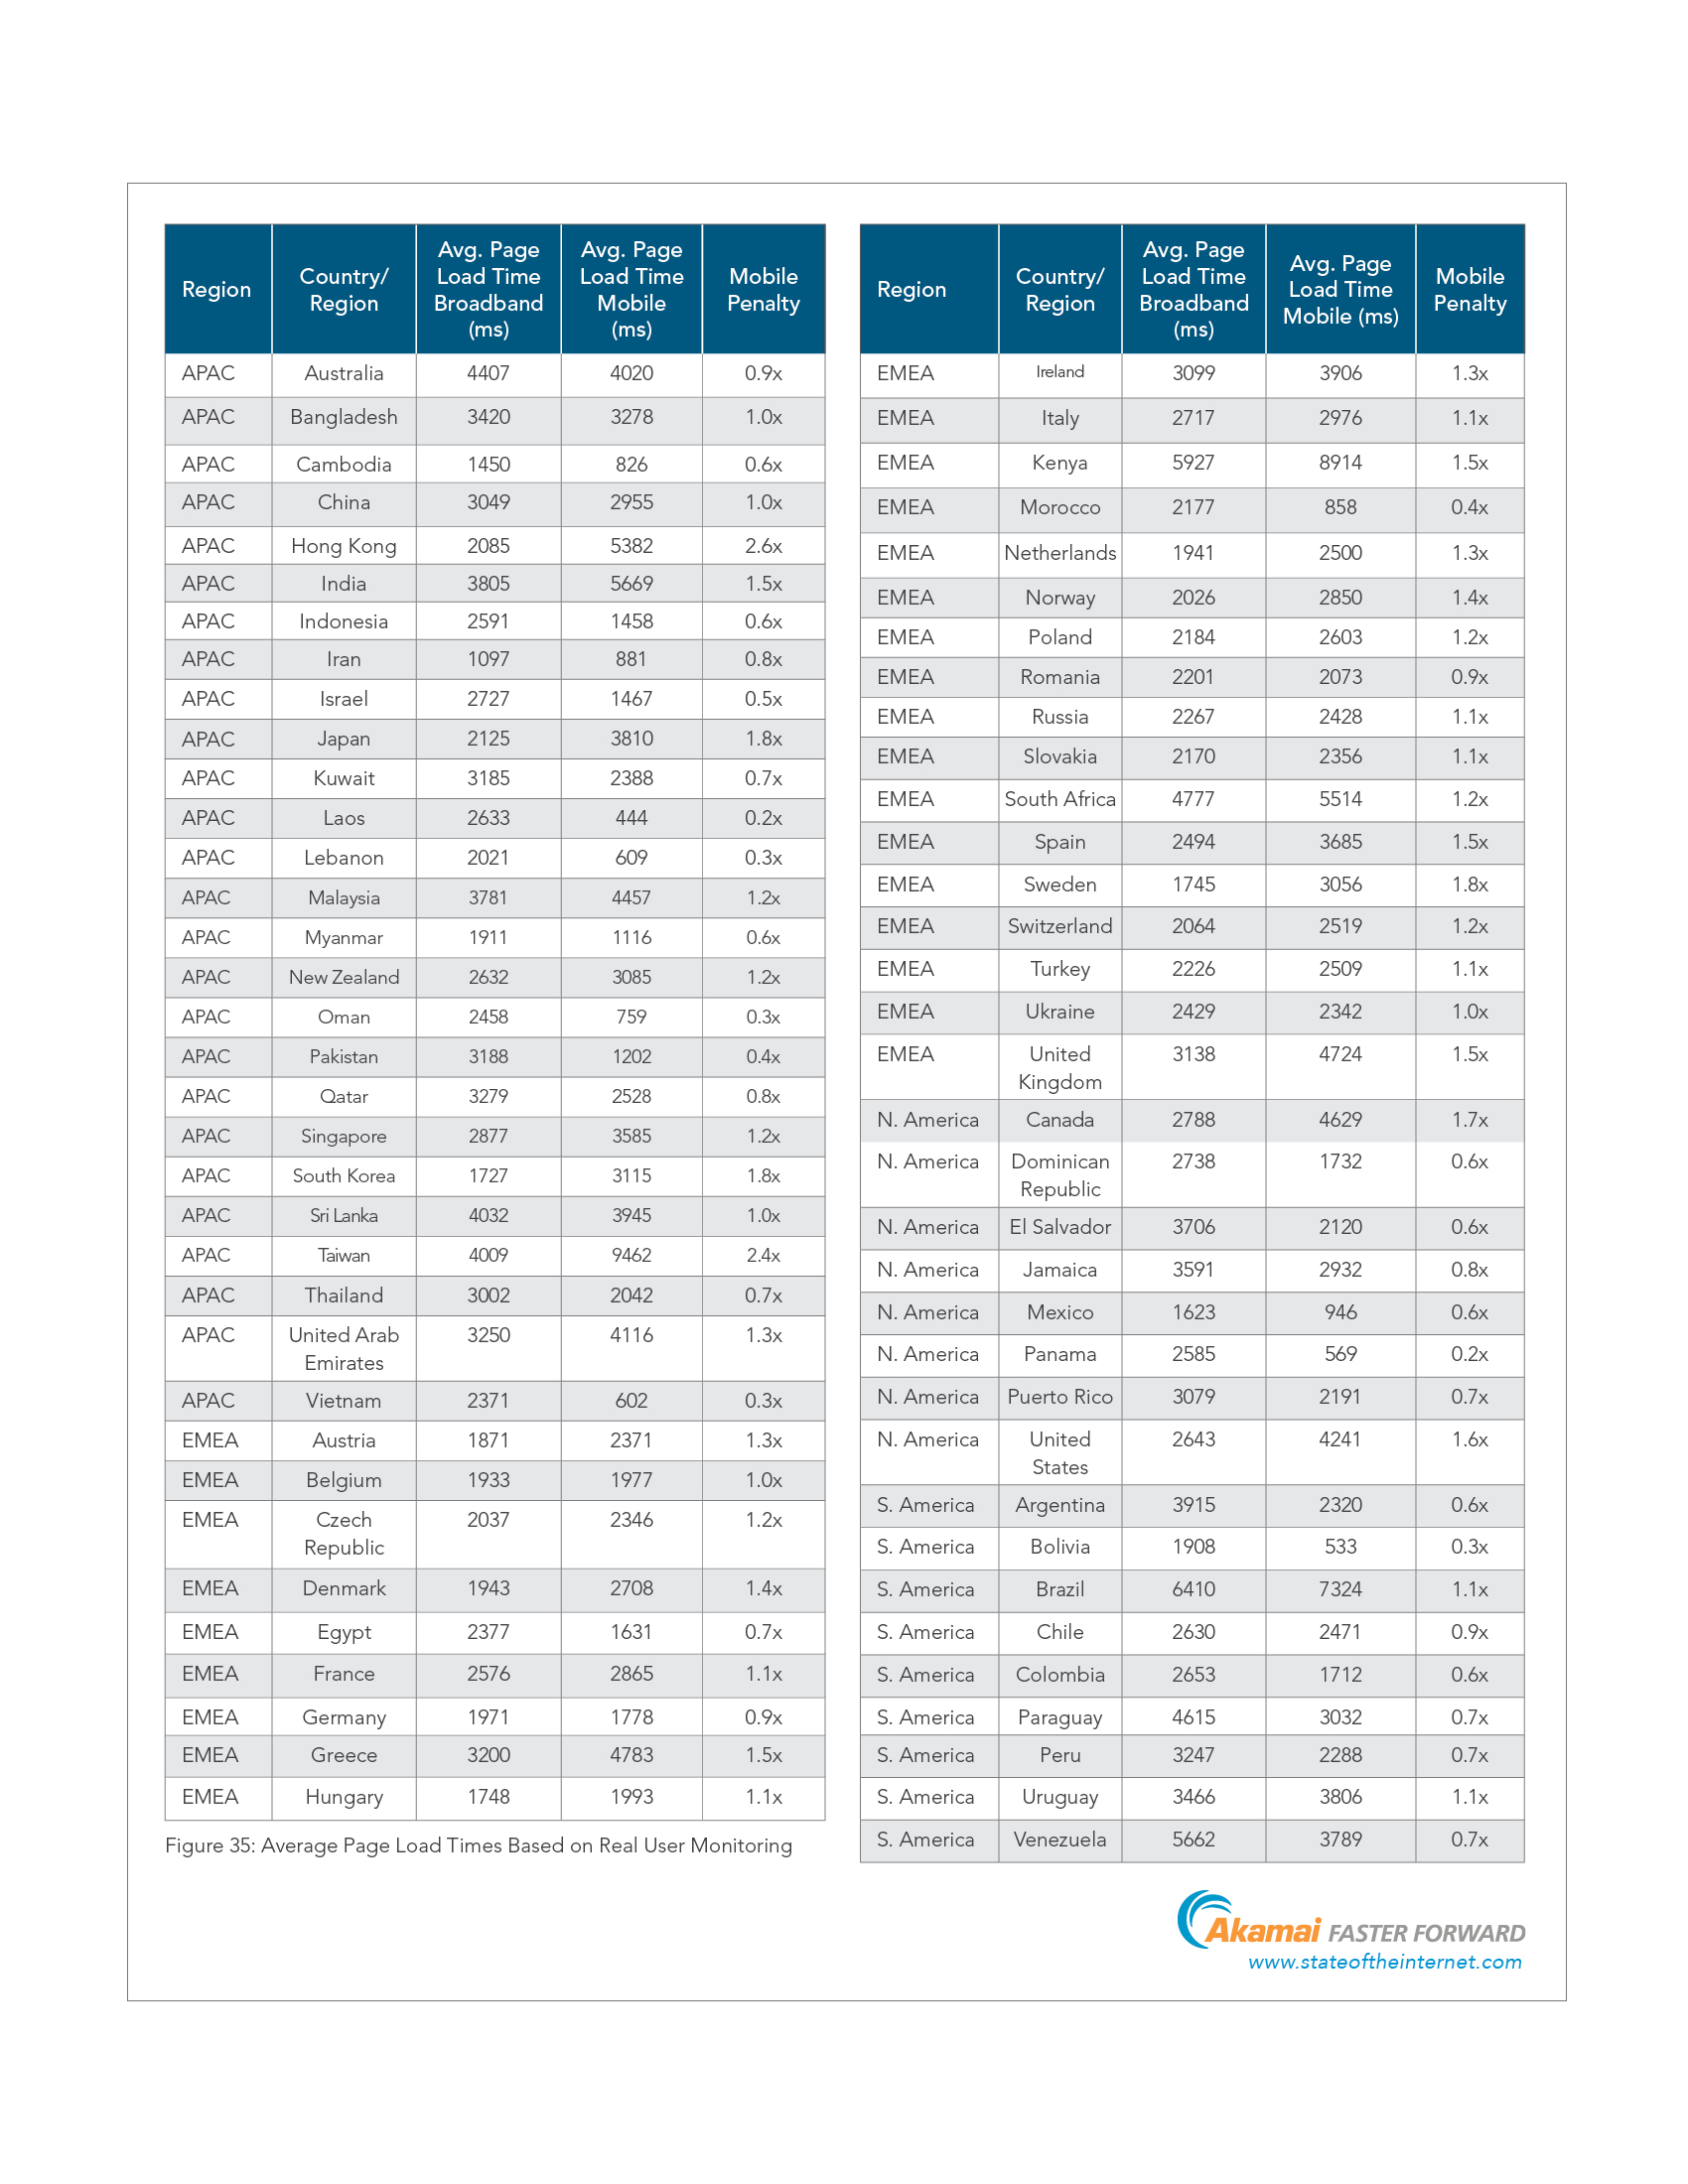
可以看到尽管表中很多国家在平均网络在前面的数据上看起来落后领先国家较多,但真实的页面平均加载时间上却并没有落后太多。
比如Hong Kong在平均网络方面要远好于Indonesia,但是从平均页面加载时间来看,Indonesia在Broadband方面也就慢500ms左右,
而且在Mobile方面甚至远好于Hong Kong.
Akamai对此的解释有如下几点:
a. 数据采集不全,这受限于RUM技术
b. 这种相应时间受多方面因素影响,而不仅仅是网速。比如页面的总大小,页面的组成以及页面是否针对移动网络优化(这点可能是导致有不少地区mobile时间还小于broadboard时间的原因)都对平均加载时间有影响。
关于第二点,我表示十分认同。因为就我自身的上网经验而言,由于直接使用手机3G网络访问网络性能实在不能忍,所以基本都是在有WiFi时才去访问。
另外如果我在一个3G或4G网络本身就很快的地区,我可能就会任性的直接使用手机网络。甚至使用手机3G网络做比如看视频,下载文件这类耗流量的事情,
也就更有可能访问page weight大的网页,造成统计平均页面加载时间相对教程的现象。
Section 9: Internet disruptions + events
这章到底在讲什么?下面是Akamai对于disruption的解释。
These disruptions may be accidental (backhoes or ship anchors severing buried fiber),
natural (hurricanes or earthquakes), or political (governments shutting off Internet access in response to unrest).
好了,理解了disruption的发生理由,大家随便看看这章就好。躺枪的国家有:Gabon, Cameroon, Nepal, Iraq。

最后是整体网络相关指标的的表格,方便对比查看。
参考资料
AKAMAI’S STATE OF THE INTERNET: Q2 2015 REPORT
Q2 2015 STATE OF THE INTERNET SUMMARY